Hermia SPECT Reconstruction
The quality of SPECT imaging is reduced by photon attenuation, resolution loss due to collimator-detector blur, photon scatter, and noise. All these factors limit both the visual quality and quantitative power of SPECT images. Hermia SPECT Reconstruction provides methods to compensate for the effects of the aforementioned four factors by modelling them in iterative reconstruction.
Quick access:
Iterative reconstruction
Attenuation compensation
Collimator and detector blur compensation
Scatter compensation
Dual isotope reconstruction
Bremsstrahlung
GPU implementation
Noise suppression
Reprojection
Quantitative reconstruction
Hermia SPECT Reconstruction-Cardiology
Simulation of short SPECT acquisitions
References
Iterative reconstruction
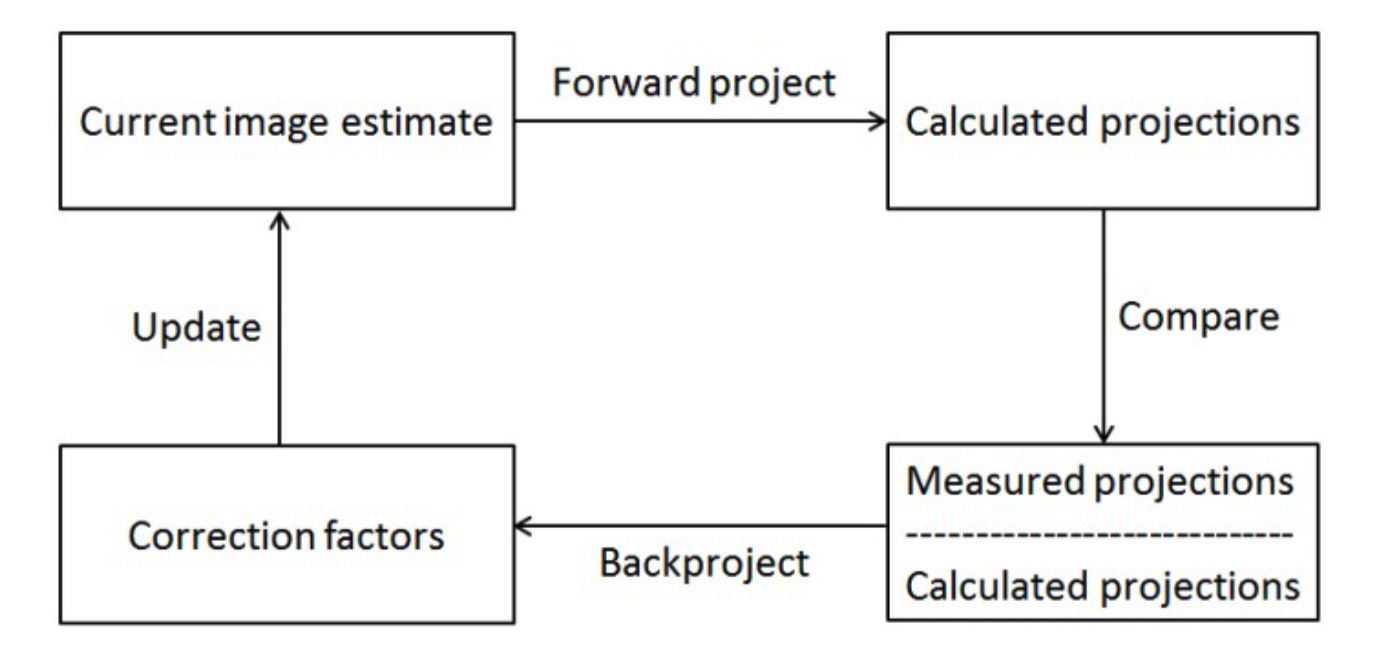
Iterative reconstruction algorithms can be thought of as consisting of 4 different phases (Figure 1):
- Calculate projections (forward project) of the current image estimate
- Compare calculated and measured projections
- Backproject correction factors based on the comparison
- Update current image estimate
After phase 4, the algorithm returns to phase 1 if the current image estimate is not yet good enough. The compensations are added to the forward- and backprojectors in phase 1 and phase 3.
Attenuation compensation
Photo-electric effect and Compton scatter reduce the number of photons from the source which reach the gamma camera detector. This reduces quantitative accuracy and can lead to false image interpretation. Attenuation can be modelled in iterative reconstruction if the attenuation map of the patient is known. SPECT Reconstruction supports several attenuation map types: uniform ellipse outline based attenuation map for brain studies [1]; synthetic attenuation maps for lung studies [2]; CT-based attenuation maps for SPECT/CT
studies and external CT-based attenuation maps for SPECT studies, where the CT was acquired on a different camera from the SPECT.
CT-images can be converted into attenuation maps using bilinear conversion. Hermes Medical Solutions has calculated the conversion equations using CT-phantom measurements for all current SPECT/CT-scanners using all the available kV-settings (see Figure 2).
Attenuation is modelled during forward and backprojections by assuming exponential loss of radiation intensity:
𝐼 = 𝐼0e – ∑𝑘𝜇𝑘𝑥𝑘
where I is the radiation intensity on detector, I0 the original intensity and ∑𝑘𝜇𝑘𝑥𝑘 is the total attenuation experienced by a photon inside the patient’s body.

Collimator and detector blur compensation
Modern gamma cameras usually have an intrinsic resolution of around 3-4 mm. In addition to detector blur, the finite size of the collimator holes cause gamma camera resolution to worsen with increasing distance to the target (Figure 3). Together these two factors lead to blurry images.
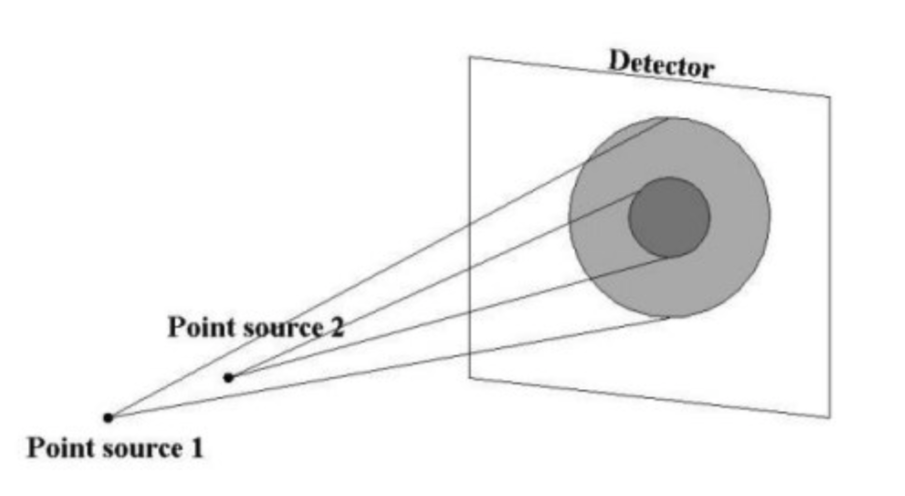
The collimator-detector blur can be reduced by modelling the collimator-detector resolution during forward and backprojections. The finite resolution is modelled by convolving the reconstruction pixel with the camera’s point-spread-function before projection. In addition to improved resolution, collimator-detector compensation also offers lower noise level images, which makes half-time imaging possible [3].
Hermia SPECT Reconstruction provides two different point-spread-function models for collimator-detector response modelling: a Gaussian model and a Monte Carlo model [4]. The Gaussian model assumes that the combined collimator-detector response is a 2D Gaussian function, whose full-width at half maximum depends on the intrinsic resolution, collimator hole length, collimator hole diameter, and distance to the front face of the detector. The Gaussian model is suitable for situations where there is little collimator septal penetration or collimator scatter e.g., for imaging with Tc-99m.
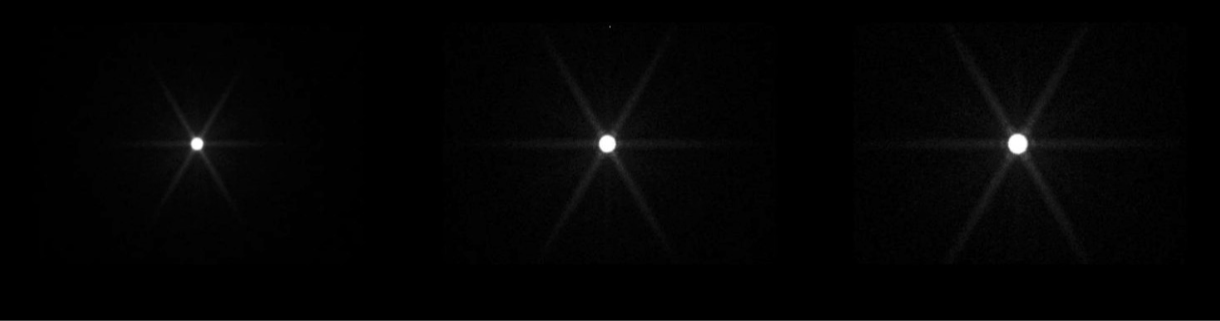
The Monte Carlo model is based on detailed Monte Carlo simulations of the collimator and detector. The Monte Carlo model takes the septal penetration and scatter into consideration and it is thus suitable for isotopes with high energy e.g. I-123, I-131 and Y-90 (Figure 4). The Monte Carlo model is only available for certain isotope and collimator combinations.
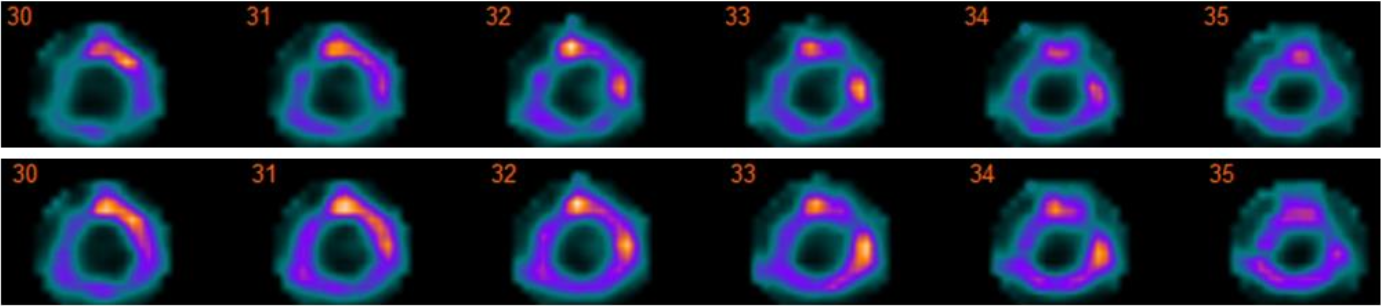
Scatter compensation
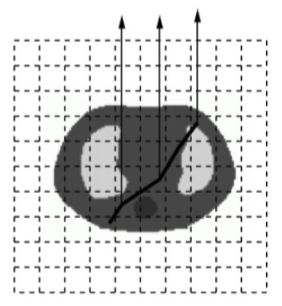
Scatter compensation is probably the most challenging of all the compensations. Scatter contribution is dependent on several factors: activity distribution; attenuation map; camera energy resolution; and energy window settings, and therefore the scatter-spread-function is difficult to parametrize. SPECT Reconstruction uses Monte Carlo based scatter compensation, where scatter inside the patient is modelled during forward projection with Monte Carlo according to the convolution-based forced detection algorithm (Figure 5) [5, 6].
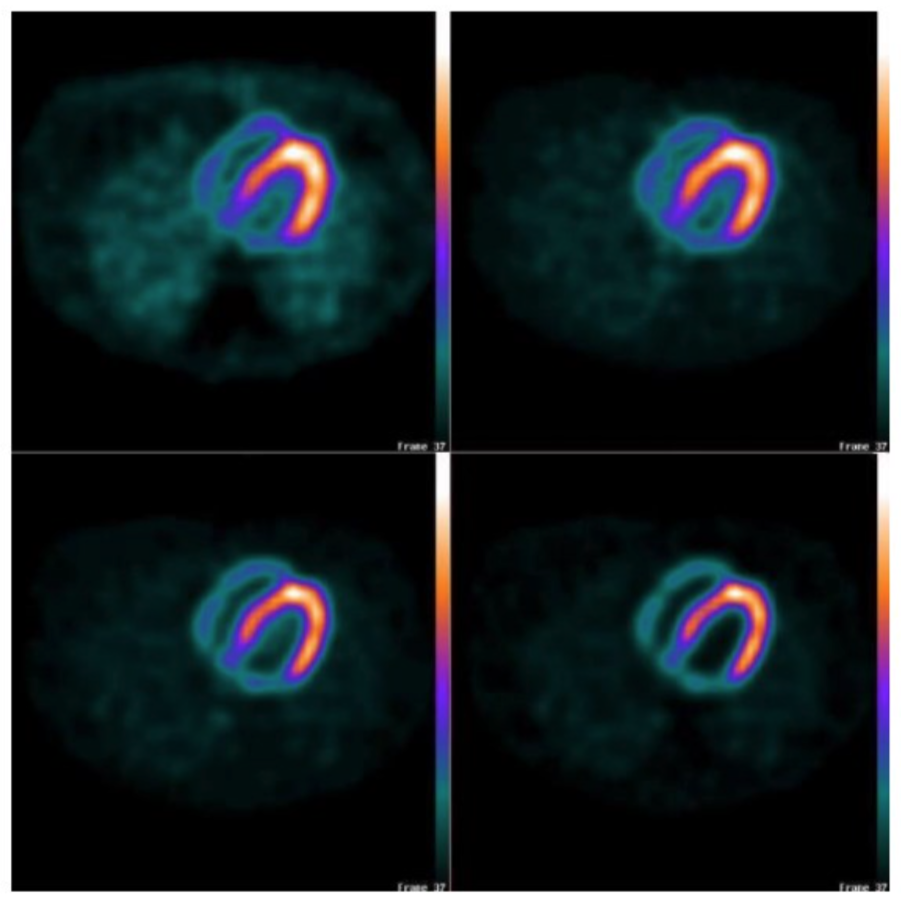
The effect of different compensation combinations are shown in Figure 6. Without attenuation compensation lung activity is incorrectly enhanced. Collimator-detector response compensation improves resolution, as demonstrated by the thinner left myocardial wall. Scatter compensation improves the contrast between left ventricle and myocardial wall by removing background activity due to scattered photons.
Dual isotope reconstruction
Hermia SPECT Reconstruction can reconstruct I-123 and Tc-99m, I-131 and Tc-99m, and In-111 and Tc-99m dual isotope studies (referred to as ‘I123&Tc99m’, ‘I131&Tc99m’, and ‘In111&Tc99m’ in the isotope list). Reconstruction always starts with the isotope that has the highest energy. This isotope is reconstructed and after reconstruction the down-scatter to the energy window of the second isotope is simulated using Monte Carlo. The down-scatter estimate is added to the scatter projections during the second reconstruction.
Bremsstrahlung
Y-90 and Ho-166 emit Bremsstrahlung which can be imaged. Bremsstrahlung has a continuous energy spectrum, which impedes the use of traditional reconstruction algorithms that assume separate energy peaks. Hermia SPECT Reconstruction uses a pre-calculated Bremsstrahlung emission energy spectrum, which is sampled during forward-projection in order to obtain the energy of the traced photon. The energy spectrum was created by simulating Y-90 and Ho-166 electrons inside a water filled sphere using the PENELOPE Monte Carlo code[7].
GPU implementation
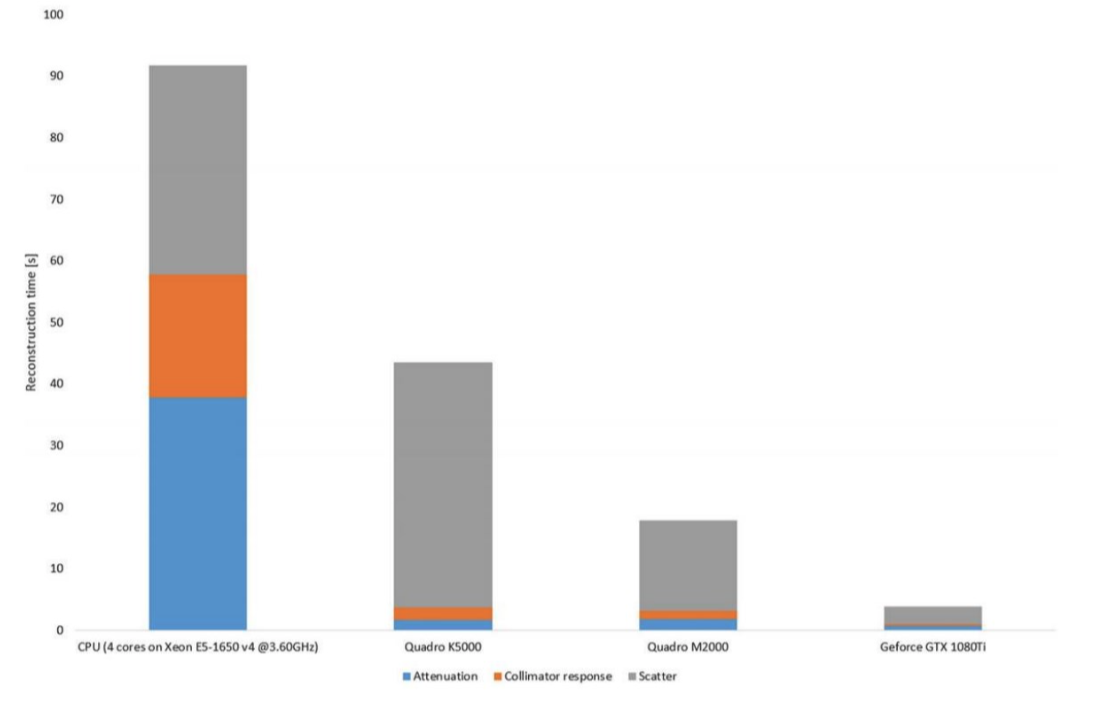
State-of-the-art SPECT reconstruction can be time consuming especially if a large matrix size has been used for projection data acquisition. Hermia SPECT Reconstruction has a GPU (graphics processing unit) accelerated version, where the entire reconstruction algorithm with all the compensations has been written using OpenCL [8]. GPU allows massive parallelization of the reconstruction process, resulting in high speed-up factors as can be seen from Figure 7.
Noise suppression
Ordered subsets expectation maximization (OSEM) is the most common iterative reconstruction method form SPECT. It can be defined as:
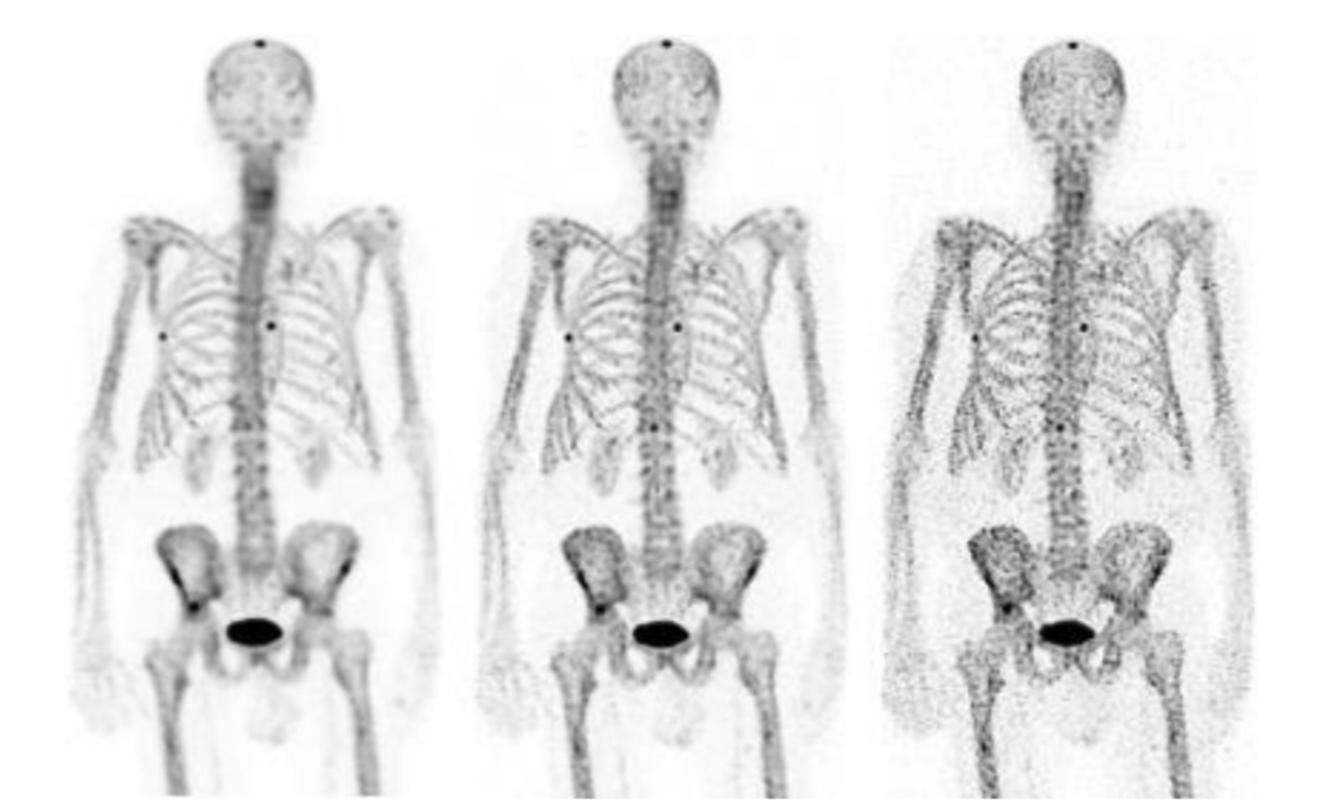
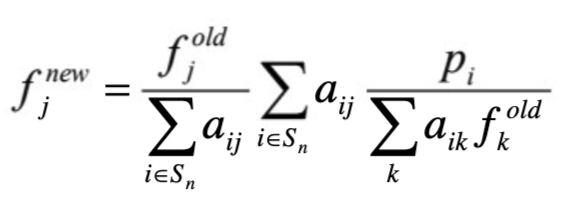 where j (or k) is the reconstruction voxel index, i projection pixel index, f new new image estimate, f old old image estimate, p the projections and aij the probability that photon emitted from voxel j (or k) is detected in projection pixel i [9]. OSEM reconstruction is degraded by noise accumulation within iterations (see Figure 8). This can be compensated for by terminating the reconstruction process early and/or by using post-filters. Both of these methods can however lead to image blurring and affect quantitation.
Noise accumulation can also be suppressed by Bayesian reconstruction. Bayesian methods can be used to introduce constraints into the reconstruction problem, which guide the reconstruction problem solution towards less noisy images. The constraints are prior information on how the reconstructed image is expected to look. A common method to include prior information into iterative reconstruction is to use the One Step Late (OSL)
algorithm [10]. OSL can be defined as:
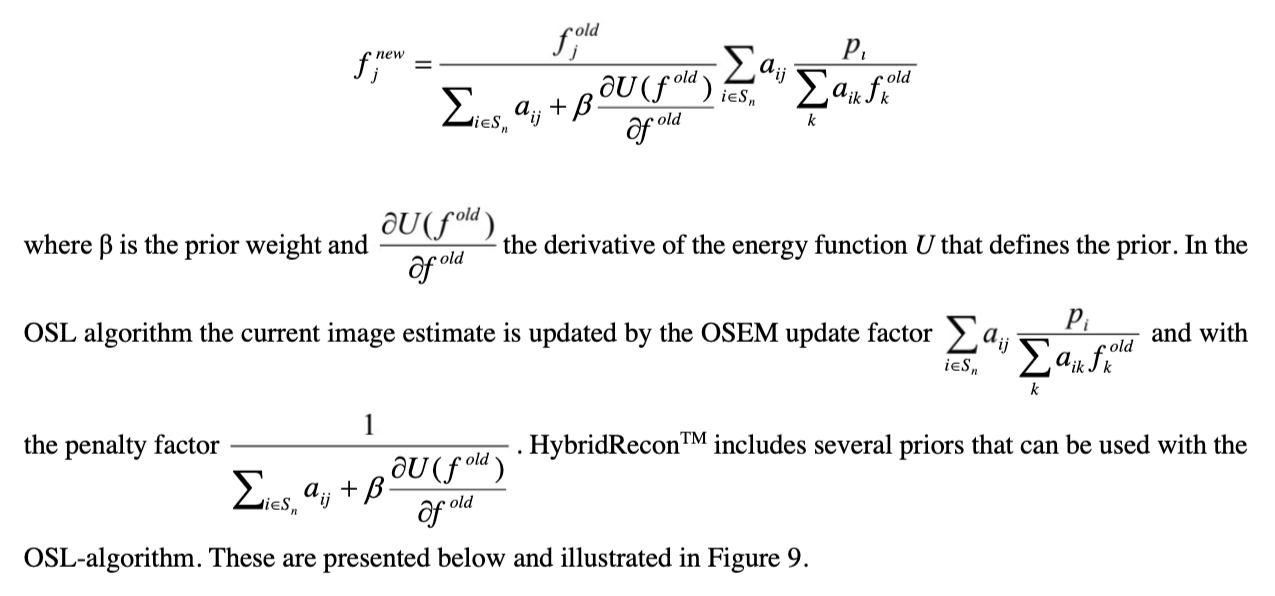 SPECT Reconstruction includes several priors that can be used with the OSL-algorithm. These are presented below and illustrated in Figure 9.
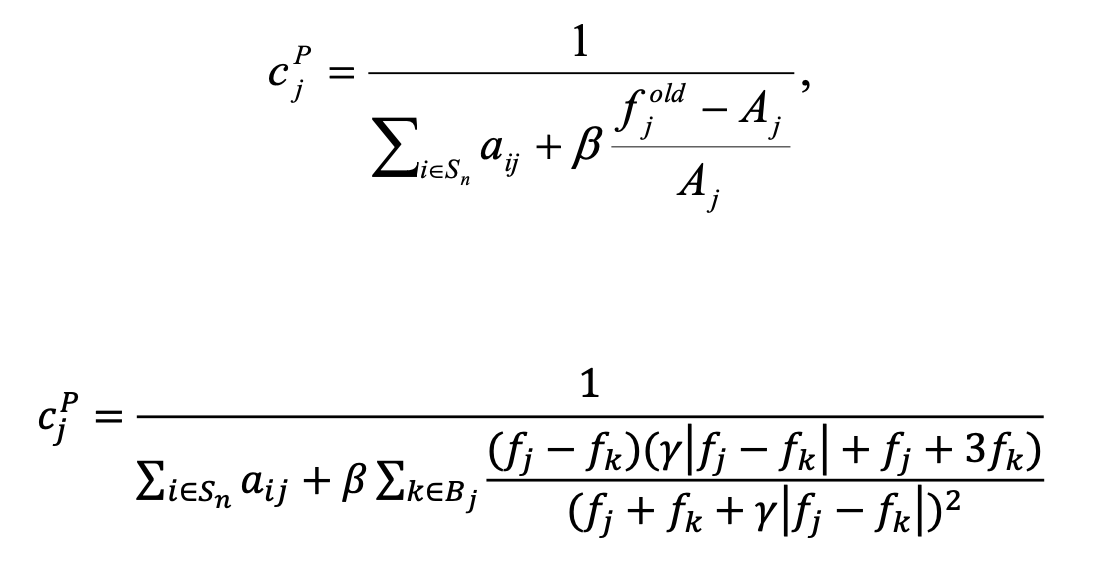
Smoothing prior ‘MAP (smoothing)’
The smoothing prior guides reconstruction towards images whose voxel values are close to neighboring voxel values. The penalty factor can be defined as:
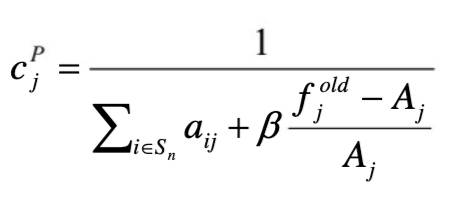
Where Aj = ΣkЄNj wjk fkold, Nj is the neighbourhood of voxel j and wjk is the neighbourhood weight, which is defined as the inverse distance from the centre voxel.
Median root prior ‘MAP (MRP)’
Smoothing priors can produce images with blurred edges. Median filtering can provide effective noise suppression without excessive edge blurring. The median root prior penalty factor can be defined as:
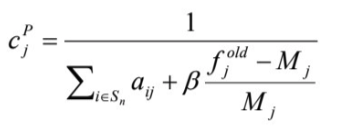
where Mj is the median voxel value in the neighborhood of voxel j [11]. FIR median hybrid prior ‘MAP (MRP-FMH)’ Median root priors can generate blocky images. In FIR median hybrid prior the chess board appearance is reduced by calculating the median of subfilters. The penalty factor can be defined as:
where Mj is the median of small subfilters in the neighborhood of voxel j [11].
L-filter prior ‘MAP (MRP-L)’ L-filter prior tries to avoid blocky images by calculating the linear combination of local ordered values instead of the local median. The penalty factor can be defined as:
where Mj = ΣkЄNj ak fkold,(k) is the index of rank ordered voxel value and ak the weight of the voxel at rank location k [11].
Relative difference prior ‘MAP (RDP)’
Relative difference prior suppresses noise but preserves image edges. Relative difference prior has gained popularity lately in PET because it is offered by one of the major PET/CT systems vendors [12]. The penalty itself is not new and can be defined as: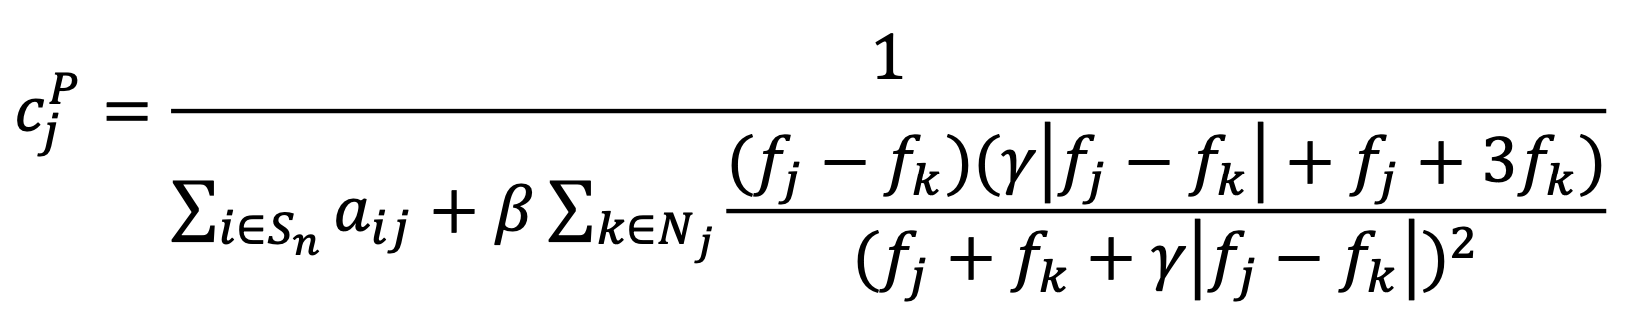
where constant γ controls the degree of edge preservation [13].
Anatomical prior ‘AMAP-S’ and ‘AMAP-R’
As previously mentioned, the smoothing prior can produce images with blurry edges. Anatomical images such as CT can be used to guide the smoothing prior to smooth only in uniform areas and to avoid edges. The penalty factors for anatomically guided smoothing prior and relative difference prior can be defined as (respectively):
 where Aj = ΣkЄB wjk fkold. These penalty factors are similar to the smoothing prior and relative difference prior penalties except that the penalty is calculated using only the B most similar voxels in neighborhood Nj [14, 15]. The most similar voxels are found by comparing the absolute differences in CT Hounsfield values.
OSEM with temporal filtering (OSEM-T)
OSEM with temporal filtering is not a Bayesian reconstruction method, but an ad-hoc noise reduction method for gated studies. In this method, the time-activity curve of each reconstructed voxel is fitted with a Fourier series after each iteration. The Fourier series is then truncated so that only the two first harmonics are kept, and the rest are set to zero. The hypothesis is that higher harmonics contain mainly noise. After truncation, the
filtered time-activity curve values are set back into reconstruction voxels [16].
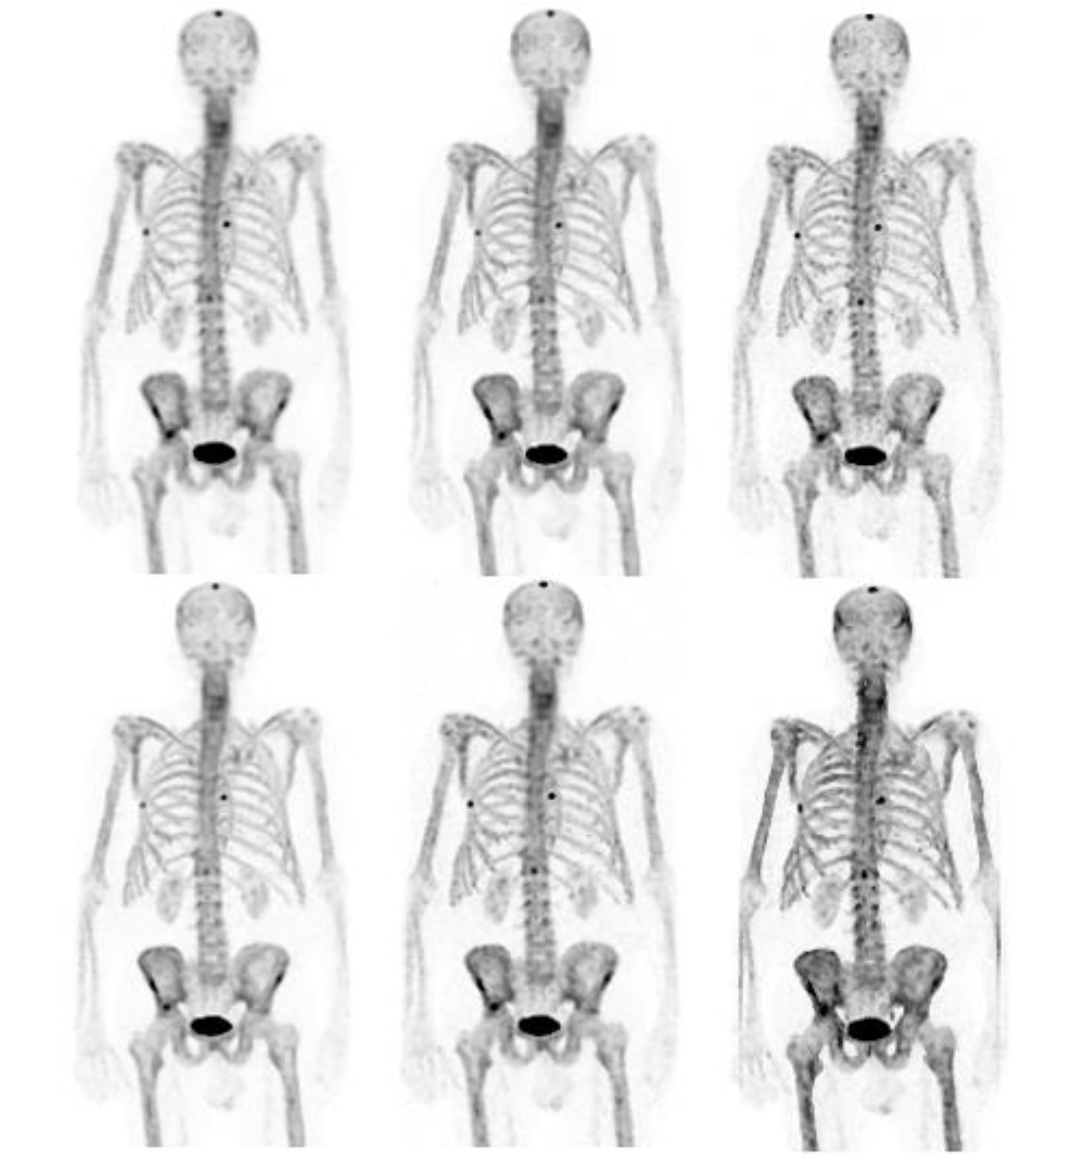
Reprojection
The shift from planar imaging to SPECT can be a big step for the person responsible for reporting the studies. To help facilitate this change, SPECT Reconstruction offers the possibility to produce synthetic planar images from reconstructed SPECT studies. The synthetic planar images are generated by projecting the reconstructed SPECT images onto artificial detector positions placed around the patient and modelling attenuation using the
attenuation map. This reprojection can be especially helpful in lung and whole body bone SPECT studies [2, 17].
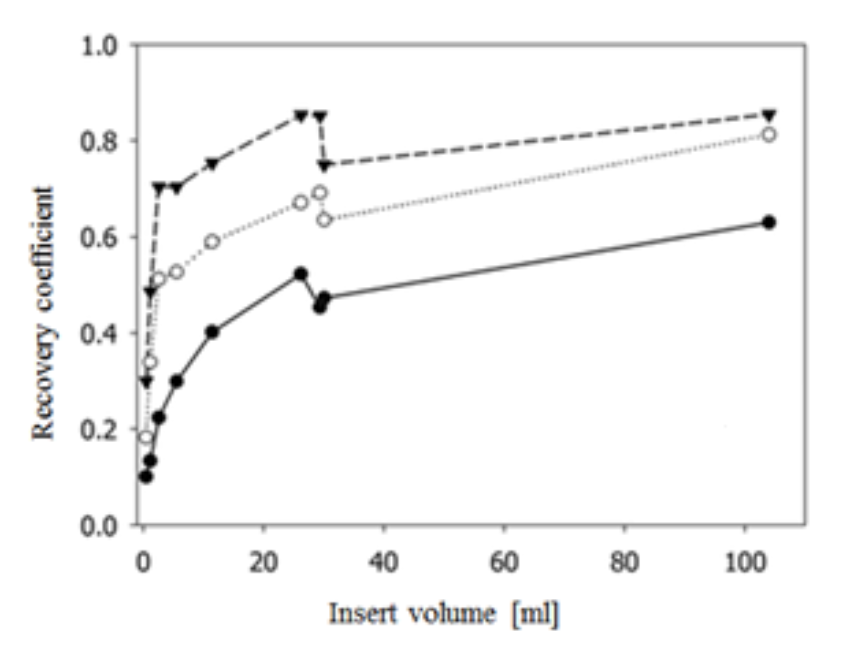
Quantitative reconstruction
SPECT voxel values can be displayed as activity concentrations. In order to do this, a conversion from counts to Bq/mL units has to be made. SPECT Reconstruction does this conversion based on a phantom measurement. An empty Jaszczak phantom (or some other similar uniform phantom) with known activity concentration is scanned and reconstructed. The conversion factor is calculated simply as the ratio between the true activity concentration and the number of reconstructed counts inside a large volume of interest located in a uniform section of the phantom.
The quantitation accuracy is dependent on the reconstruction compensation methods. Figure 11 shows comparison of quantitative accuracy between different compensation methods. The results are from an anthropomorphic phantom scan acquired on a SPECT/CT scanner with spherical inserts of different sizes filled with Lu-177 inside the phantom. Best results were obtained when attenuation, collimator-detector response,
and scatter compensation were applied.
Hermia SPECT Reconstruction-Cardiology
Automatic myocardium detection
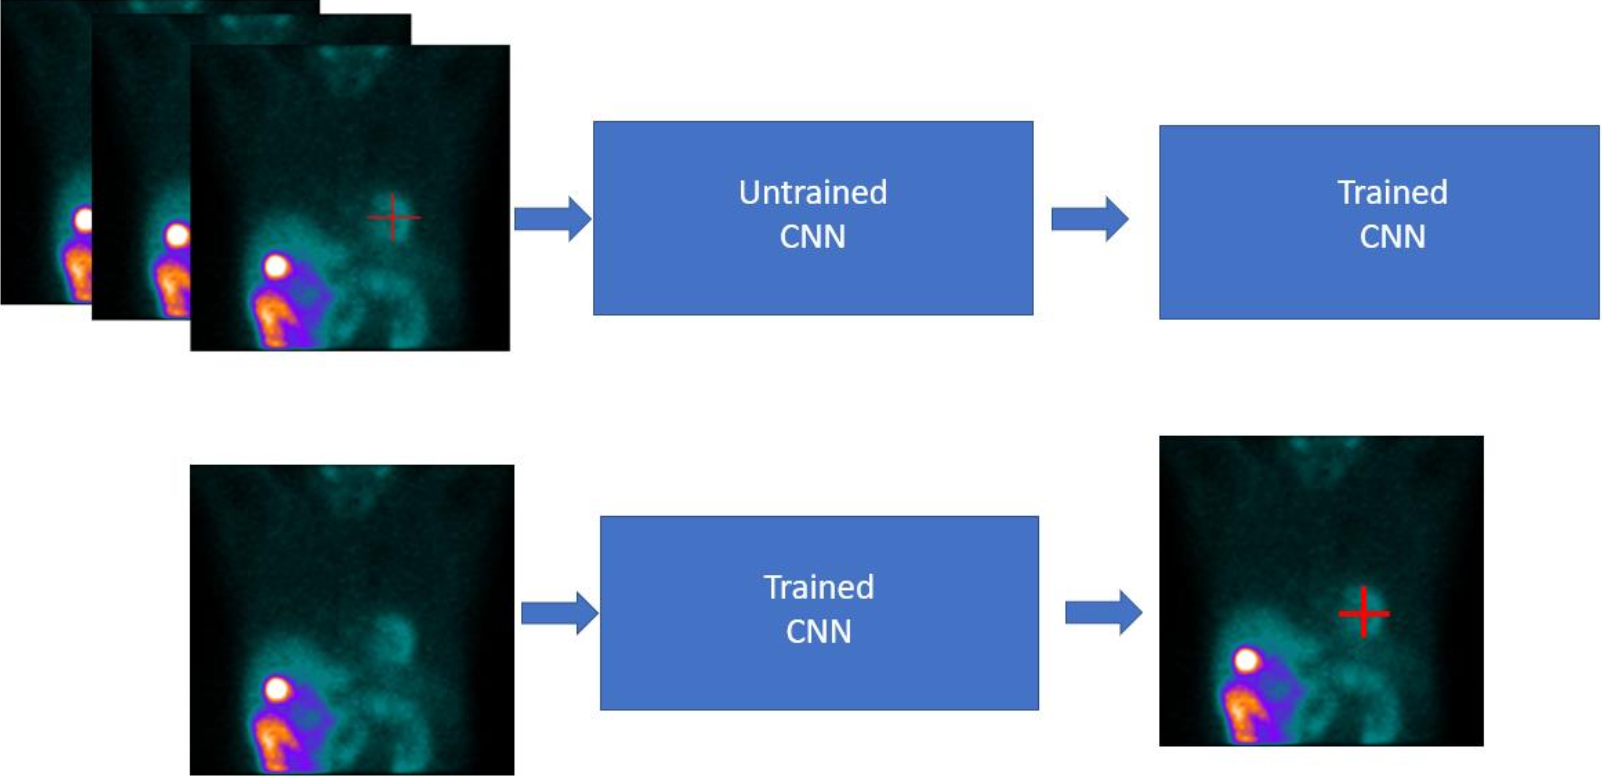
Hermia SPECT Reconstruction-Cardiology performs automatic myocardium detection when a SPECT acquisition study is loaded. The detection algorithm is based on deep learning and uses a convolutional neural network with multiple layers and filters. The network was trained with thousands of clinical myocardial perfusion SPECT acquisition study samples with known heart locations (Figure 12). The algorithm detects the myocardium from anterior and left anterior oblique projections and applies triangulation in order to obtain the location of the myocardium in 3D space.
Motion correction
The motion correction algorithm of Hermia SPECT Reconstruction is based on the reconstruction-reprojection principle. Reconstruction of motion corrupt data provides SPECT images whose position is an average of the acquisition projection positions. By comparing the original projections to projections generated by reprojecting the reconstructed SPECT we can obtain individual projections shifts which minimize the spatial difference of the original and reprojected projections. The cost-function used to measure the difference of the original and reprojected projection is based on squared difference of the projection pixel values. In case of Hermia SPECT ReconstructionCardiology, the cost function calculation is limited to the heart area by a bounding ellipse, which is automatically set by a deep learning algorithm. This allows the algorithm to focus more on the motions of the
heart.
Automatic cardiac orientation
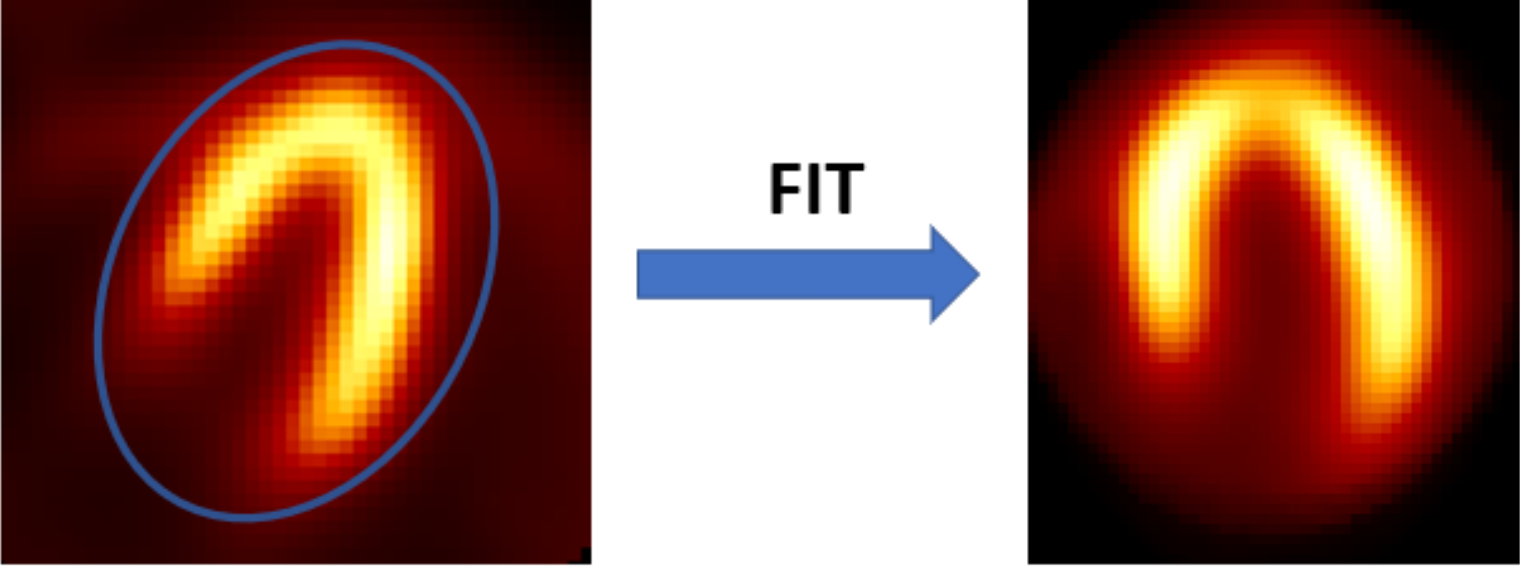
Hermia SPECT Reconstruction-Cardiology automatically rotates reconstructed cardiac images into short-axis slices. The reorientation algorithm first makes a coarse segmentation of the myocardium in order to remove extra cardiac uptake. After segmentation, automatic 10-parameter registration with a squared difference cost-function to a myocardium model is made. The model was built based on several correctly orientated myocardial perfusion
studies. Final alignment is obtained by extracting rotation angles from the registration parameters (Figure 13).
Detection of myocardial walls
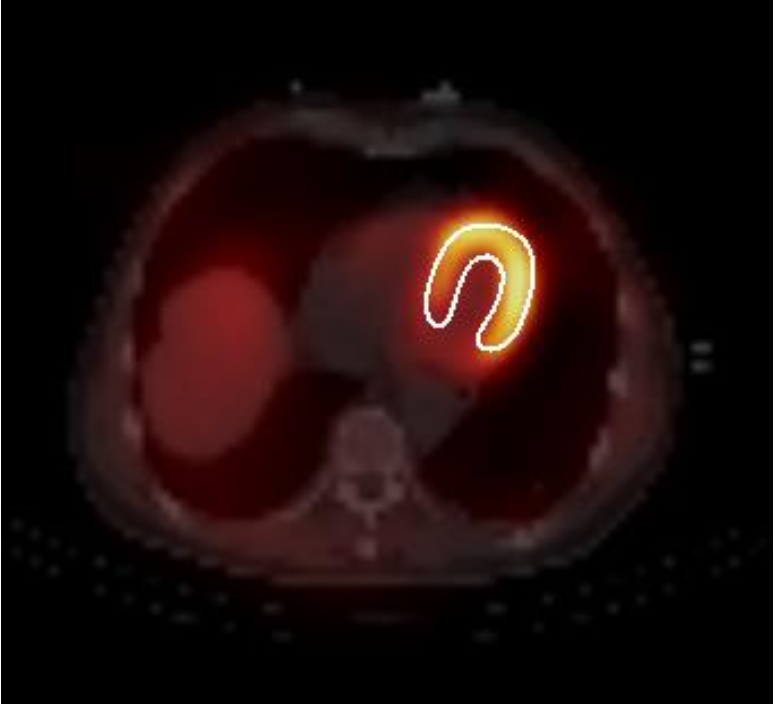
Hermia SPECT Reconstruction-Cardiology automatically detects the inner and outer walls of the myocardium and shows the cardiac outline on top of CT in order to aid SPECT/CT registration (Figure 14). The detection algorithm is based on ray-tracing and Gaussian fitting of the traced myocardium profiles on the short-axis slices.
Simulation of short SPECT acquisitions
Hermia SPECT Reconstruction allows the simulation of SPECT studies with a user-defined percentage of the original counts. The simulation algorithm redistributes the data of the acquired SPECT scan using binomial deviates. The algorithm allows user to choose a fixed or unique seed for the random number generator. A fixed seed always produces the same (random) sample of acquisition data, whereas a unique seed provides unique noise realization.
References
1. Gillen R, Firbank MJ, Lloyd J, O'Brien JT. CT-based attenuation and scatter correction compared with
uniform attenuation correction in brain perfusion SPECT imaging for dementia. Phys Med Biol. 2015;
60:6775-6787.
2. Bailey DL, Schembri GP, Harris BE, Bailey EA, Cooper RA, Roach PJ. Generation of planar images
from lung ventilation/perfusion SPECT. Ann Nucl Med. 2008; 22:437-445.
3. Kangasmaa T, Kuikka J, Vanninen E, Mussalo H, Laitinen T, Sohlberg A. Half-time myocardial
perfusion SPECT imaging with attenuation and Monte Carlo-based scatter correction. Nucl Med
Commun. 2001; 32:1040-1045.
4. Sohlberg A, Kajaste M. Fast Monte Carlo-simulator with full collimator and detector response modelling
for SPECT. Ann Nucl Med. 2012; 26:92-98.
5. de Jong H, Slijpen E, Beekman F. Acceleration of Monte Carlo SPECT simulation using convolution
based forced detection. IEEE Trans Nucl Sci. 2001; 48:58-64.
6. Sohlberg A, Watabe H, Iida H. Acceleration of Monte Carlo-based scatter compensation for cardiac
SPECT. Phys Med Biol. 2008; 21:N277-285.
7. Baró J, Sempau J, Fernández-Varea J M and Salvat F. PENELOPE: an algorithm for Monte Carlo
simulation of the penetration and energy loss of electrons and positrons in matter. Nucl. Instrum.
Methods Phys. Res. B 1995;100:31–46.
9. Hudson M, Larkin RS. Accelerated image reconstruction using ordered subsets of projection data. IEEE
Trans Med Imaging. 1994; 13:601-609.
10. Green PJ. Bayesian reconstructions from emission tomography data using a modified EM algorithm.
IEEE Trans Med Imaging. 1990; 9:84-93.
11. Alenius S, Ruotsalainen U. Generalization of median root prior reconstruction. IEEE Trans Med
Imaging. 2002; 21:1413-1420.
12. Teoh EJ, McGowan DR, Macpherson RE, Bradley KM, Gleeson FV. Phantom and clinical evaluation of
the Bayesian penalized likelihood reconstruction algorithm Q.Clear on an LYSO PET/CT system. J Nucl
Med. 2015;56:1447–52.
13. Nuyts J, Beque D, Dupont P, Mortelmans L. A concave prior penalizing relative differences for
maximum-a-posteriori reconstruction in emission tomography. IEEE Trans Nucl Sci. 2002; 49:56-60.
14. Kangasmaa T, Sohlberg A, Kuikka J. Reduction of collimator correction artefacts with Bayesian
reconstruction in SPECT. Int J Mol Imaging, Article ID: 630813, 2011.
15. Kangasmaa TS, Constable C, Sohlberg AO. Quantitative bone SPECT/CT reconstruction utilizing
anatomical information. EJNMMI Phys. 2021; 6;8(1):2.
16. Vanhove C, Franken PR, Defrise M, Deconinck F, Bossuyt A. Reconstruction of gated myocardial
perfusion SPET incorporating temporal information during iterative reconstruction. Eur J Nucl Med Mol
Imaging. 2002; 29:465-472.
17. Kyrtatos PG, Navalkissoor S, Burniston M, Wagner T. Planar images reprojected from SPECT V/Q data
perform similarly to traditional planar V/Q scans in the diagnosis of pulmonary embolism. Nucl Med
Commun. 2013 May;34(5):445-50.
Other scientific publications involving SPECT Reconstruction
Kangasmaa T, Hippeläinen E, Constable C, Turunen S, Sohlberg A. Quantitative Monte Carlo-based brain
dopamine transporter SPECT imaging. Ann Nucl Med. 2021 Jan;35(1):17-23.
Peters SMB, Meyer Viol SL, van der Werf NR, et al. Variability in lutetium-177 SPECT quantification
between different state-of-the-art SPECT/CT systems. EJNMMI Phys. 2020;7(1):9.
Scully PR, Morris E, Patel KP, Treibel TA, Burniston M, Klotz E, Newton JD, Sabharwal N, Kelion A,
Manisty C, Kennon S, Ozkor M, Mullen M, Hartman N, Elliott PM, Pugliese F, Hawkins PN, Moon JC,Menezes LJ. DPD Quantification in Cardiac Amyloidosis: A Novel Imaging Biomarker. JACC Cardiovasc
Imaging. 2020 Jun;13(6):1353-1363.
Brady SL, Shulkin BL. Analysis of quantitative [I-123] mIBG SPECT/CT in a phantom and in patients with
neuroblastoma. EJNMMI Phys. 2019 Dec 30;6(1):31.
Peters SMB, van der Werf NR, Segbers M, van Velden FHP, Wierts R, Blokland KJAK, Konijnenberg MW,
Lazarenko SV, Visser EP, Gotthardt M. Towards standardization of absolute SPECT/CT quantification: a
multi-center and multi-vendor phantom study. EJNMMI Phys. 2019 Dec 26;6(1):29.
Roberts G, Lloyd JJ, Petrides GS, O'Brien JT, Thomas AJ. Cardiac 123I-MIBG planar heart to mediastinum
ratios depend on patient size; phantom studies suggest SPECT-CT could improve quantification. Biomed
Phys Eng Express. 2019 Dec 19;6(1):015011.
Tzortzakakis A, Holstensson M, Hagel E, Karlsson M, Axelsson R. Intra- and Interobserver Agreement of
SUV SPECT Quantitative SPECT/CT Processing Software, Applied in Clinical Settings for Patients with
Solid Renal Tumors. J Nucl Med Technol. 2019 Sep;47(3):258-262.
Robin P, Klein R, Gardner J, Ziebarth B, Bazarjani S, Razavi S, Zuckier LS, Zeng W. Quantitative analysis
of technetium-99m-sestamibi uptake and washout in parathyroid scintigraphy supports dual mechanisms of
lesion conspicuity. Nucl Med Commun. 2019 May;40(5):469-476.
Arvola S, Jambor I, Kuisma A, Kemppainen J, Kajander S, Seppänen M, Noponen T. Comparison of
standardized uptake values between 99mTc-HDP SPECT/CT and 18F-NaF PET/CT in bone metastases of
breast and prostate cancer. EJNMMI Res. 2019 Jan 24;9(1):6.
Porter CA, Bradley KM, Hippeläinen ET, Walker MD, McGowan DR. Phantom and clinical evaluation of
the effect of full Monte Carlo collimator modelling in post-SIRT yttrium-90 Bremsstrahlung SPECT
imaging. EJNMMI Res. 2018 Jan 22;8(1):7.
Kangasmaa TS, Constable C, Hippeläinen E, Sohlberg AO. Multicenter evaluation of single-photon emission
computed tomography quantification with third-party reconstruction software. Nucl Med Commun. 2016
Sep;37(9):983-7.
© The software described in this document and the software itself is copyrighted and all rights are reserved by Hermes Medical Solutions. Neither the software nor the manual may be copied or in any other way reproduced without prior consent in writing from Hermes Medical Solutions who reserve the right to make changes and improvements to the software and the document at any time. This document is not a supplement and does not in any way replace the labeling and user instructions to be used with the product. Hermes Medical Solutions welcomes feedback from readers of this manual. Please report any errors in content or typography and suggestions for improvements by E-mail.